-
Notifications
You must be signed in to change notification settings - Fork 48.5k
Automatically Profile roots when DevTools is present #13058
New issue
Have a question about this project? Sign up for a free GitHub account to open an issue and contact its maintainers and the community.
By clicking “Sign up for GitHub”, you agree to our terms of service and privacy statement. We’ll occasionally send you account related emails.
Already on GitHub? Sign in to your account
Automatically Profile roots when DevTools is present #13058
Conversation
|
ReactDOM: size: 0.0%, gzip: -0.0% Details of bundled changes.Comparing: 8e87c13...854ef7e react-dom
react-art
react-test-renderer
react-reconciler
react-native-renderer
Generated by 🚫 dangerJS |
packages/shared/ReactFeatureFlags.js
Outdated
| @@ -39,6 +39,9 @@ export const warnAboutLegacyContextAPI = false; | |||
| // Gather advanced timing metrics for Profiler subtrees. | |||
| export const enableProfilerTimer = __PROFILE__; | |||
|
|
|||
| // If the DevTools hook is present, inject into it. | |||
| export const supportDevToolsIfPresent = false; | |||
There was a problem hiding this comment.
Choose a reason for hiding this comment
The reason will be displayed to describe this comment to others. Learn more.
Shouldn't this be true? I think this caused devtools code to get DCE'd in open source builds.
| @@ -279,6 +281,10 @@ class ReactTestInstance { | |||
| return this._currentFiber().memoizedProps; | |||
| } | |||
|
|
|||
| get treeBaseTime(): number { | |||
There was a problem hiding this comment.
Choose a reason for hiding this comment
The reason will be displayed to describe this comment to others. Learn more.
The Devtools are going to use a private api to access this data in a way that we support only because we can push new versions of it so mitigates maintainance burden.
You can use the private api to test this behavior since the private api is the “internally public” api, the one actually used.
Even if we wanted to expose this in the future I don’t think we are ready to do that yet.
There was a problem hiding this comment.
Choose a reason for hiding this comment
The reason will be displayed to describe this comment to others. Learn more.
Sure, that makes sense.
| 'font-weight:bold', | ||
| ); | ||
| if (__DEV__) { | ||
| if (!foundDevTools && canUseDOM && window.top === window.self) { |
There was a problem hiding this comment.
Choose a reason for hiding this comment
The reason will be displayed to describe this comment to others. Learn more.
I didn’t realize we limit it to the top most frame. Seems hacky and unfortunate limitation.
|
Ping 😄 |
| @@ -21,6 +21,7 @@ export const warnAboutDeprecatedLifecycles = false; | |||
| export const warnAboutLegacyContextAPI = false; | |||
| export const replayFailedUnitOfWorkWithInvokeGuardedCallback = __DEV__; | |||
| export const enableProfilerTimer = false; | |||
| export const supportDevToolsIfPresent = false; | |||
There was a problem hiding this comment.
Choose a reason for hiding this comment
The reason will be displayed to describe this comment to others. Learn more.
Why not?
111a4f0 to
3e22e59
Compare
|
What is the utility in making |
|
We definitely could. I don't feel strongly about this. It just seemed a little odd for the OSS react-test-renderer to have DevTools injection logic, when it doesn't really support or interact with DevTools in a meaningful way. |
|
Does it hurt to have it though? I imagine one might build some interactive React tutorial that embeds the test renderer. Would be cool if DevTools worked with it. |
|
No, not really. As the PR description mentions, I made a few judgement calls here that I don't feel strongly about 😄 This is one of them. I'll back it out. |
| let mode = isAsync ? AsyncMode | StrictMode : NoContext; | ||
|
|
||
| if (enableProfilerTimer && isDevToolsPresent) { | ||
| // Always collect profile timings when DevTools are present. |
There was a problem hiding this comment.
Choose a reason for hiding this comment
The reason will be displayed to describe this comment to others. Learn more.
This only affects the profiling bundle, right?
At first I was a bit worried we'd do this in production mode too, but now I realized that we seemingly don't. Then it should be fine.
In general we try to avoid any extra overhead based on DevTools presence (i.e. until we actually connect). But a bit of overhead in profiling bundle specifically (and not in production) seems okay to me.
There was a problem hiding this comment.
Choose a reason for hiding this comment
The reason will be displayed to describe this comment to others. Learn more.
Yes, it only affects profiling builds.
There was a problem hiding this comment.
Choose a reason for hiding this comment
The reason will be displayed to describe this comment to others. Learn more.
LGTM assuming my understanding is correct, and any overhead only affects profiling mode bundles.
I'd probably remove supportDevToolsIfPresent. I don't think it gives us something valuable, and each flag adds some maintenance cost and a chance of getting it wrong (as happened in this PR twice 😛 ).
There is some weird artifact with ReactTestRendererComponentTree.js showing up in diff view with no changes. Not sure what that's about.
|
|
||
| // Measure observable timing using the Profiler component. | ||
| // The time spent in App (above the Profiler) won't be included in the durations, | ||
| // But needs to be acocunted for in the offset times. |
There was a problem hiding this comment.
Choose a reason for hiding this comment
The reason will be displayed to describe this comment to others. Learn more.
Typo
There was a problem hiding this comment.
Choose a reason for hiding this comment
The reason will be displayed to describe this comment to others. Learn more.
Had to read 3x to spot it
|
|
||
| // Measure observable timing using the Profiler component. | ||
| // The time spent in App (above the Profiler) won't be included in the durations, | ||
| // But needs to be acocunted for in the offset times. |
There was a problem hiding this comment.
Choose a reason for hiding this comment
The reason will be displayed to describe this comment to others. Learn more.
Typo
| // At this point, the base time should include both: | ||
| // The initial 9ms for the components that do not re-render, and | ||
| // The updated 6ms for the component that does. | ||
| expect(rendered.root.findByType(App)._currentFiber().treeBaseTime).toBe(15); |
There was a problem hiding this comment.
Choose a reason for hiding this comment
The reason will be displayed to describe this comment to others. Learn more.
Can you explain more about why this is completely unobservable? Is it because it's only used for the UI, and not reported by the Profiler component? Should it be reported by Profiler component somehow?
There was a problem hiding this comment.
Choose a reason for hiding this comment
The reason will be displayed to describe this comment to others. Learn more.
Maybe "unobservable" isn't the right word to use, but this time value won't be tracked at all unless the DevTools are detected– because App isn't inside of a Profiler root (which is intentional or this test).
There was a problem hiding this comment.
Choose a reason for hiding this comment
The reason will be displayed to describe this comment to others. Learn more.
My main concern is with using _currentFiber() here which isn't a public API. Is there any way we could write these tests without reaching into the fiber data structure? If not (and if that's how DevTools works anyways) then it's okay.
There was a problem hiding this comment.
Choose a reason for hiding this comment
The reason will be displayed to describe this comment to others. Learn more.
I don't think so. Also, this is kind of doing what Sebastian suggested (assuming I understood his comment correctly).
There was a problem hiding this comment.
Choose a reason for hiding this comment
The reason will be displayed to describe this comment to others. Learn more.
DevTools wouldn't be using _currentFiber() but yeah, this seems like the easiest way without bringing the backend itself into this repo. I assume you're reading treeBaseTime from the Fiber in DevTools—can't check because I'm not sure where the code is.
|
Thanks for the review, Dan 😄 |
…n/treeBaseDuration

This is an unobservable change to all but the (under development) DevTools Profiler plugin. It is being done so that the plugin can safely feature detect a version of React that supports it. The profiler API has existed since the 16.4.0 release, but it did not support the DevTools plugin prior to PR facebook#13058.

Side note: I am not a big fan of the term "base duration". Both it and "actual duration" are kind of awkward and vague. If anyone has suggestions for better names– this is the best time to bikeshed about them.
…n/treeBaseDuration (#13156)

This is an unobservable change to all but the (under development) DevTools Profiler plugin. It is being done so that the plugin can safely feature detect a version of React that supports it. The profiler API has existed since the 16.4.0 release, but it did not support the DevTools plugin prior to PR #13058.

Side note: I am not a big fan of the term "base duration". Both it and "actual duration" are kind of awkward and vague. If anyone has suggestions for better names– this is the best time to bikeshed about them.
* react-test-renderer injects itself into DevTools if present
* Fibers are always opted into ProfileMode if DevTools is present
* Added simple test for DevTools + always profiling behavior
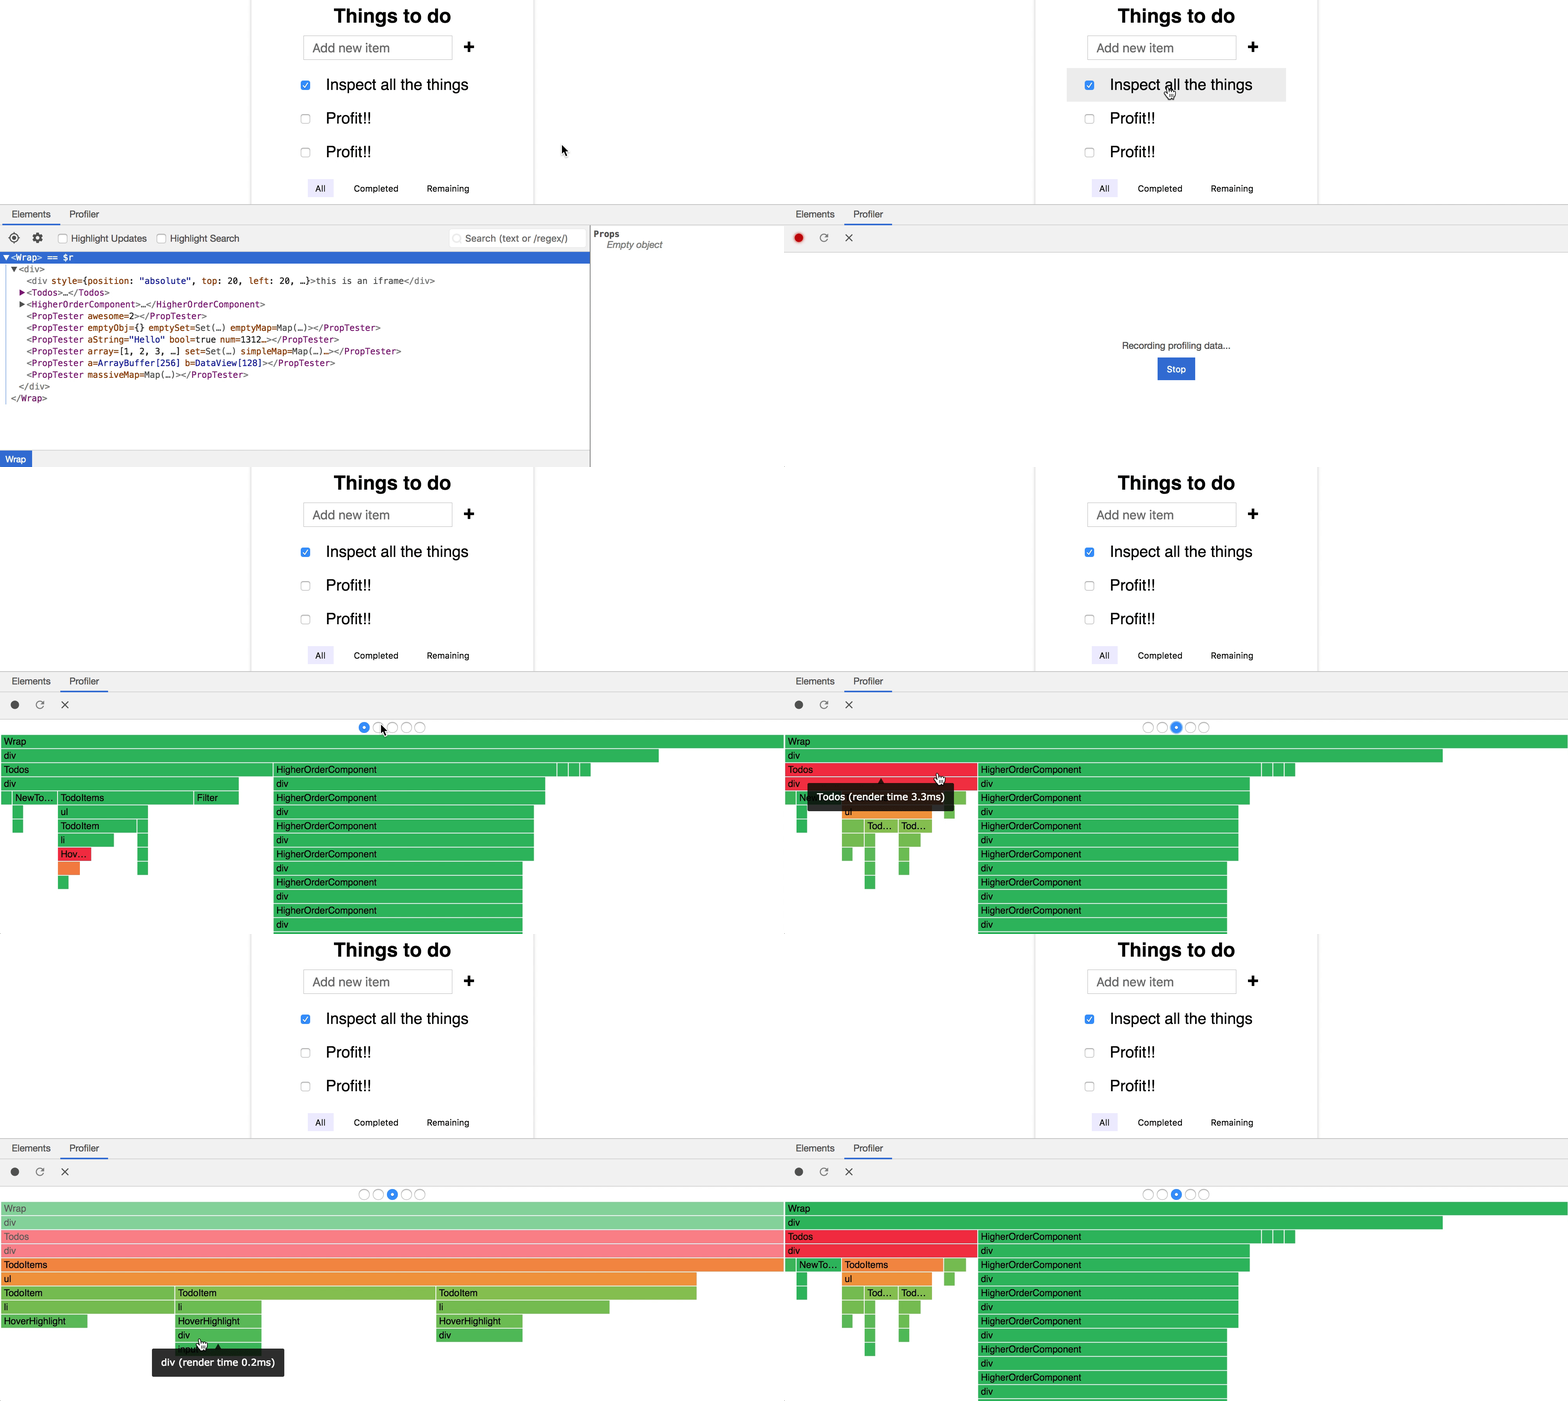
I'm working on a new DevTools plug-in that uses the new profiler timings to create charts about an application's rendering performance. One of these charts will be a flame graph that shows all fibers in an application. The width of each fiber will be based on its


treeBaseTime(the time it last took to render) and the color will be based on how much time it took relative to the longest running parts of the commit. Here's a small demo:Profiling when DevTools are present
My original idea was for DevTools to walk each root and turn
ProfileModeon for all fibers when the user started profiling. (PR #12910 was created in order to support this functionality.) I made an oversight though. React does not collect timing information for fibers that aren't inProfileMode, and soselfBaseTimeandtreeBaseTimevalues are all set to 0. This means that when a user starts profiling, base times are all 0. These times get updated when a fiber next renders– but not if it bails out. This means that in some cases, parts of the tree will not have base times and the resulting graph will be inaccurate.There are a couple of options to address this:
modewhen recording starts.)shouldComponentUpdate) when profiling is started so that all fiber are guaranteed to have a base time value.This PR adopts the first option, but I'm happy to discuss the second one if there are strong preferences or concerns.
Testing DevTools profiler integration
This PR also updates the test renderer to inject itself into DevTools if the global hook is present. This was done so that I could add a test for the otherwise unobservable profiling behavior. (It may also be useful for other tests.)
I made a few judgement calls here that I don't feel strongly about and would be happy to discuss changing:
findFiberByHostInstancemethod because I didn't want to add the overhead of mapping instances to fibers until/unless we had a need for that feature.supportDevToolsIfPresentfeature flag, which is only enabled for the tests that depend on it.